This is one of the first few projects I did with the Arduino that has a wide reach of applications, and would be great for any beginner to get started with working dynamically with different programs rather than the closed environment of the Arduino IDE.
Arduinos can be used for a wide variety of projects. In these projects, we would come across many cases where we would have to read data from one of the digital or analog ports(A0 to A5), and format it the way we want - format it into graphs, text files, excel files, etc. This data could come from anywhere - from sensors like ultrasonic sensors and pressure sensors, from other Arduinos, or from any other program in the computer.
However, once we retrieve the data using the digitalRead() or the AnalogRead() function, we cannot do much with it in the Arduino IDE. The most we could do is print it onto the Serial monitor, graph it into the crude Serial Plotter, or use other libraries which are rather complex and difficult to understand.
That is why I think the best way to handle data that needs to be stored and formatted in different ways, is to transfer it to a python file. Python is one of the easiest languages to learn, and has a large number of easy to use and ready-made libraries and modules that could help us format data.
So in this blog, I am going to show you how I used this method to retrieve analog data using the Arduino, transferred it to a python file using Serial communication, and graphed it using the python pyplot library.
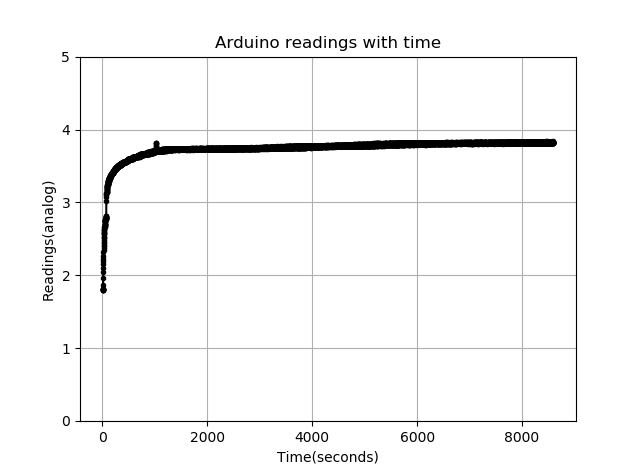
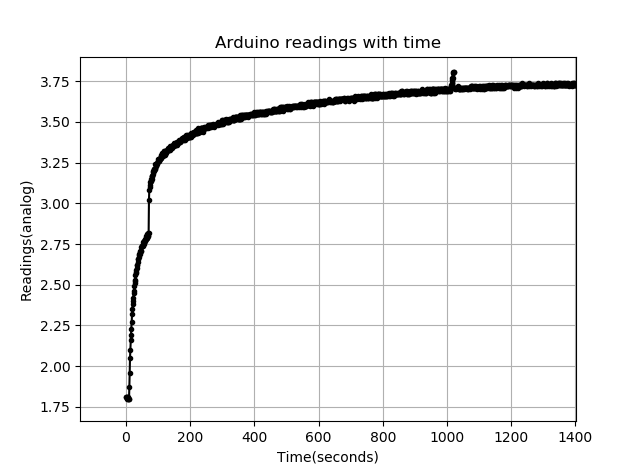
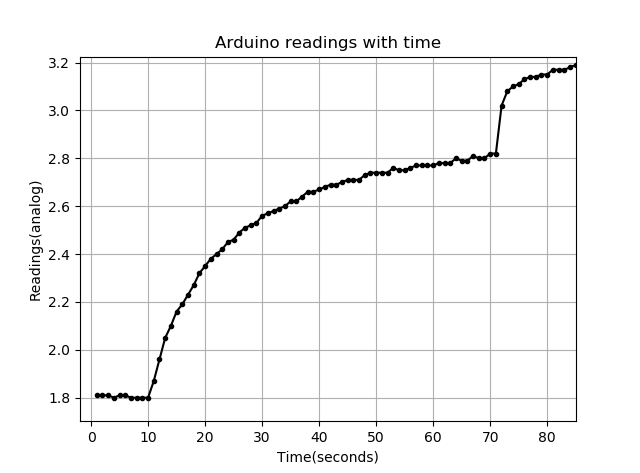
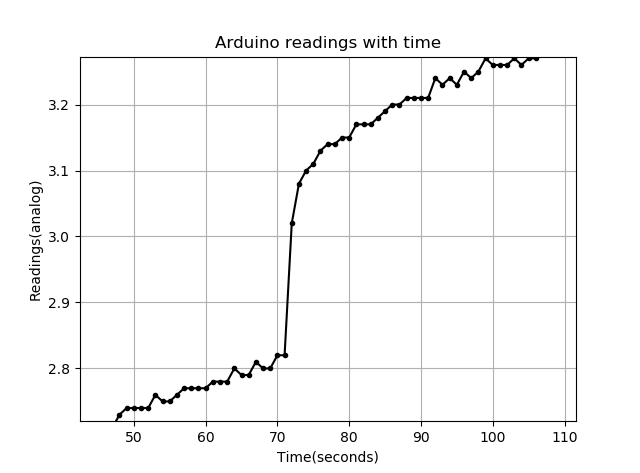
In this project, I was charging li-ion batteries using a charger module, and wanted to see how the voltage of the charging batteries changed with time.
In your case, you may want to see how the speed of a motor may vary with distance using rotary encoders, how pressure changes in different places using a pressure sensor, or even control the arduino by transferring certain commands from python to Arduino, and back. What I’ve done is simply take two streams of data - voltage readings from the analog port, and clock readings for time, and compared them. You could take the same method and apply it to whatever you want.
Now as for the program, there are two parts - the Arduino part, and the Python part.
The Arduino part:
First, make note of the digital pin from which you’re reading data from(A0-A5 or Digital pin 1-13). Then, in the setup, start Serial Communication with the Serial.begin(54000) function. Next, in the loop, print the data readings onto the Serial monitor using the Serial.println() function.
Now, you should be getting a steady flow of data in the serial monitor.
The python part:

The most important part of the python program is importing the serial library(which you can install by typing <pip install pyserial> in cmd).
After importing it, the next thing to do is to set up Serial communicationline 3 in the image below), and some additional information, to get valid data(line number).
This method, or function, has 3 parameters. The first one, is the port number, which the computer assigns to the Arduino. You can see the port by clicking Tools>Port in the Arduino IDE
The second parameter is the baudrate, the rate at which data is transferred. Here, the value should be the SAME value as what you chose for the Serial.begin(...). If they are different values, data will not be transferred, and you will get some errors.
The third parameter is the ‘timeout’. This is the number of seconds we wait for data. If we don’t get any data after the specified number of seconds, the program will print whatever data it has, and exit. This prevents an infinite loop in case of any error, and the python program waits for data forever.
The next few lines begin a while loop, and starts reading the data. The .decode(“ascii”) strips the output unwanted data(try it without the decode method).
At this point, you have got a functioning program(with the Arduino code and Python code running at the same time) where there is data transfer from the Arduino to the Python shell. Good job!
At this point, I made some slight modifications to the program.
I made the arduino check for an input from the Python program(which is simply a letter), only after which it will begin to send data.
Next, and more importantly, in the python program, I dumped all the data received from the arduino into a pickle file. This is a very important step in dealing with data - storage into a file.
But you can pick any kind of file to store data - json, csv, etc. I have chosen pickle files because you can extract data from it the easiest. (If you’re going to deal with excel files, chose csv files)
Given below are the two code snippets showing the changes I made.
void setup() {

  pinMode(A0, INPUT);
  Serial.begin(57600);
}


void loop() {

  if (Serial.available() > 0){  // Serial.available checks the number
                                //of bytes streaming in the serial
                                //port.
    user_input = Serial.read();

    if (user_input == 'g'){
      while true{
        data = analogRead(A0);
        // this program is a little simplified for easy understanding,
           but I will explain it later.
        // In the actual program, I am printing THREE data points
           continuously to the serial line:
        // One is the Raw data. One is the processed data(which is just
           raw data after a few operations). The last, is TIME(using
           millis())
        Serial.println(data);

      }
    }
  }
}
import serial
import pickle
ser = serial.Serial('COM5', baudrate = 57600, timeout = 1)
pkl_file = input("Enter the pickle file name where the values are saved: ")
decision = input("If you want to start, press 'g'. If you want to stop, press 's'")
# In this program, I am getting three data points from the Arduino in #the form of a string <(data1, data2, data3)> (the data3 is time in #seconds)
# I then SPLIT the string using the <string.split(',')>, convert each of them to integers or floats, and use them however I want
if decision == 'g':
ser.write(b'g') # Here we write the letter 'g' into the serial
#line. the 'b' before the 'g' is to signify we're
#transfering a byte.
while True:
values_string = ser.readline().decode('ascii')
if len(values_string) == 0: #These few lines are a result
#of a problem I encountered
print("Length is 0!!") #Sometimes this program returns
#any empty string(idk why)
continue #and it screws up the whole
#prgm...so I added the
#'continue' to go on with the program
values_list_string = values_string.split(',')) #In tese two lines I split the string that is transferred form the #Arduino
values_list_int = [float(values_list_string[0]), float(values_list_string[1]), float(values_list_string[2]) ] # and #convert them to floats
list_time.append(values_list_int[2]) # Very important #step. Keep appending the data to a list. This may be a problem when #dealing with an extrememtly large number of data points, but you #should be fine.
list_reading.append(values_list_int[0]) # when dealing with #an insanely large amount of data points, but you should be alright
print(values_list_string[0] + ' , ' + values_list_string[2])
# here, every 10 seconds, I dump all the data I have got into a #pickle file.
# Keep in mind that <values_list_int[2]> is time. I am #receiving the number of seconds that have gone by from the arduino #using the millis function
if values_list_int[2] % 10 == 0:
with open(pkl_file, 'wb') as f:
pickle.dump([list_time, list_reading], f)
else:
pass
else:
pass
Now, the most exciting part. We’re going to GRAPH the data. We transferred all the data we need into a pickle file, and this file will always be there for our use. All were going to do is retrieve data from this pickle file, and graph it.
Graphing data in python couldn’t be easier. We are going to use Pyplot from the Matplotlib library(which can be downloaded easily from cmd using <pip install>).
In the first function, plt.plot, we tell the program what data we’re going to plot in the x-axis and the y-axis(they have to be LISTS), what design we want for the line, and the label of the graph.
The ylim function makes the graph much easier to read, the plt.show function displays the graph, and finally, we use time.sleep to wait for a veryyy small amount of time, which is very important.
Thus, we have successfully collected some form of data using the Arduino, printed it to the Serial line, stored it in a pickle file, and graphed it!
This is the program to graph the data. You can run this program seperately any time you want, as long as there is a pickle file with data in it.
from matplotlib import pyplot as plt
import time
import pickle

pkl_file = input("Enter the name of the file to be graphed: ")
time.sleep(1)
while True:

    with open(pkl_file, 'rb') as f:
        list_time, list_reading = pickle.load(f)

    plt.plot(list_time, list_reading, '.-k', label = 'Readings')
    plt.xlabel('Time(seconds)')
    plt.ylabel('Readings(analog)')
    plt.title("Arduino readings with time")
    plt.grid(True)
    plt.ylim(0, 5)
    plt.show()

    time.sleep(0.0001)
[Edit on 21 Nov 2020]
Now, as for the results, here are a few images to show how convinient and easy it is to look at the data that is now graphed with matplotlib with multiple viewing options, rather than raw data spanning over hundreds of lines.
Keep in mind, this is just a bare-bone structure of how you can deal with data using the Arduino, and you can do so much more with these libraries. Keep experimenting and find new ideas!


Comments